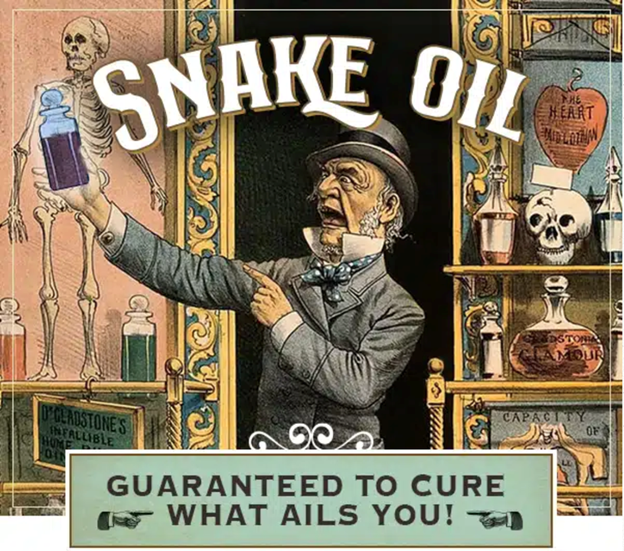
What’s your sales ailment? We have the cure! In a recent 2023 research study, 98% of all SaaS Sales Leaders responded that their five (5) biggest sales challenges were:
- Deals are taking longer to close (60 days – 120 days)
- More Deals are ending up in the dreaded “No Decision” state (67%)
- Less Sales Reps are attaining their annual sales quotas (64%)
- Inadequate Sales Pipelines (1.5X-2X vs. 3X-5X target)
- Taking too long to ramp up new Sales Hires (9 months+)
Does this sound familiar? What if I told you that I just made it up. Well not really… as I talk to SaaS Sales Leaders every day and they are my customers that we partner with to help solve their biggest sales problems. But I did make up the recent research study and the cited statistics.
My point here is that there is a HUGE difference between anecdotal evidence (e.g., gut feel) and statistically significant empirically researched facts. I had the best College Professor for both Statistics I and Statistics II. He actually found a way to make being a Math nerd cool.
At the start of the semester in Stats I, I would sit in the very last row of a huge lecture hall that sat 200 students in ridiculously uncomfortable wooden chairs that squeaked every time you moved. I would attempt to quietly drink my giant Dunkin’ Donuts (Double D’s to any self respecting Bostonian) coffee while reading the Boston Globe Sports section. My Professor had eagle eye vision and would proactively call me out to engage in Stats Q & A sessions.
I hated him for this at first. Then the requisite 50% of the Stats class would drop out of the class before the deadline because it was really hard and demanding. What did my Professor do? He made the remaining students in the class collapse into the first few rows in the massive lecture hall. No longer could I hide unnoticed in the dark back row and peacefully drink my Double D’s coffee while reading every article in the Boston Globe Sports section. Foiled! This lazy student was forced into being engaged and interactive in the class.
Professor Chakraborty loved Statistics. It was his passion in life to teach us students to at least appreciate the value of Statistics in business and life. It worked with me. I found myself looking forward to his class each week. I actually did the studying and homework for the class vs. my regular mid term and final cramming studying sessions for other classes.
One key principle that Professor Chakraborty taught us was the significance of “N” in Statistics. What is “N” and why is it so important? “N” is the sample size or number of people/companies, etc. that participated in the research or study that Statistics are commonly cited from. Here is a Wikipedia primer on Sample Size for those interested: https://en.wikipedia.org/wiki/Sample_size_determination
Remember the Crest Toothpaste’s famous advertising and promotional campaign; “Four out of Five Dentists polled recommended Crest Toothpaste to their patients.” What if the sample size or “N” that the Market Research company that did this research for Crest only polled five Dentists? And in fact Four out of those Five Dentists that they polled did recommend Crest to their patients. Crest could extrapolate from this poll and make the claim that 80% of Dentists recommend Crest to their patients.
What’s the problem with that extrapolation? It simply is NOT a statistically empirical fact. Why? Because the sample size or “N” of 5 as a percentage of the total population of Dentists in the United States is far too smalI to infer anything with statistical confidence. In 2022, there were over 200,000 Dentists in the United States. That sample size compared to the total population of Dentists (5/200,000) equals .00000025%.
After Stats I and Stats II, I ended up working for a prominent Marketing Research company in Boston while still in College. I started off as a researcher conducting polls and surveys in malls for consumer products. Then I graduated into recruiting people to participate in high end professionally video taped Focus Groups. Finally, I was a night shift Manager where we would do outbound market research polls and surveys on behalf of our customers.
What did I learn from the owners of the Market Research firm? The whole thing is rigged! We would reverse engineer the stats and results that our clients wanted. And then we would word the surveys and polls and Focus Group questionnaires to produce the results our clients wanted. It was not unbiased and objective. We chose specific demographics to suit whatever results our clients wanted to provide as unbiased market research. We gerrymandered the sample size or “N” to suit our client’s needs and get the survey/poll results they wanted.
So next time you see a recent research study cited on LinkedIn (LI) with some associated charts full of Statistics… challenge the “N”! What sample size did they use in their research study? Is that sample size statistically significant or not compared to the total population? There are between 30,000 and 50,000 SaaS companies worldwide. When a LinkedIn Snake Oil Salesman posts an article on SaaS sales benchmarking trends with associated research/study Statistical results… what is the “N” or sample size cited in their study?
I’ve seen numerous LI posts on SaaS Sales Benchmarking studies with an “N” or sample size of 39. That means they only polled 39 SaaS companies in their study. 39 SaaS companies as a sample size out of 30,000 total SaaS companies. Your bullshit meter should be going off in full force.
Good selling!
For those that want to geek out, here is a sample size calculator from the Gold Standard for Empirical Statistical Research, Qualtrics:
https://www.qualtrics.com/blog/calculating-sample-size/

